Python and IoT: A Lighting Replay Application
Thu 27 October 2016 by Jeff FischerThis is a summary of the IoT project described in my BayPiggies talk. The full slides (including additional details) are here.
I built an end-to-end application which monitors the light levels in several rooms of a residence and then replays a similar pattern when the house is uncocupied. The goal is to make the house look occupied, with a lighting pattern that is different every day, but looks realistic. It accounts for the different patterns found in each individual room as well as seasonal factors (e.g. changing sunrise/sunset times). The full source code for the application is availble on github here. It makes extensive use of the AntEvents IoT framework.
The application was built in three phases: 1) data capture, 2) data analysis, and 3) the lighting player.
Data Capture
The capture subdirectory contains the code to capture and record light sensor readings.
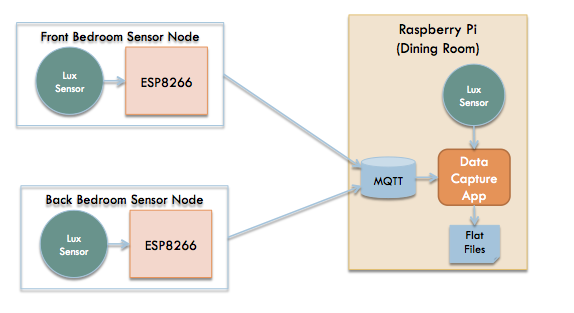
Light sensor data is gathered through two ESP8266 boards running Micropython and sent over an MQTT queue to a central server app running on a Raspberry Pi. The Raspberry Pi reads from the queue and saves the data to flat csv files. It also has a light sensor, which it samples and saves to a flat file as well.
Examples of captured data from three different rooms may be found here.
Capturing lux (light level) data
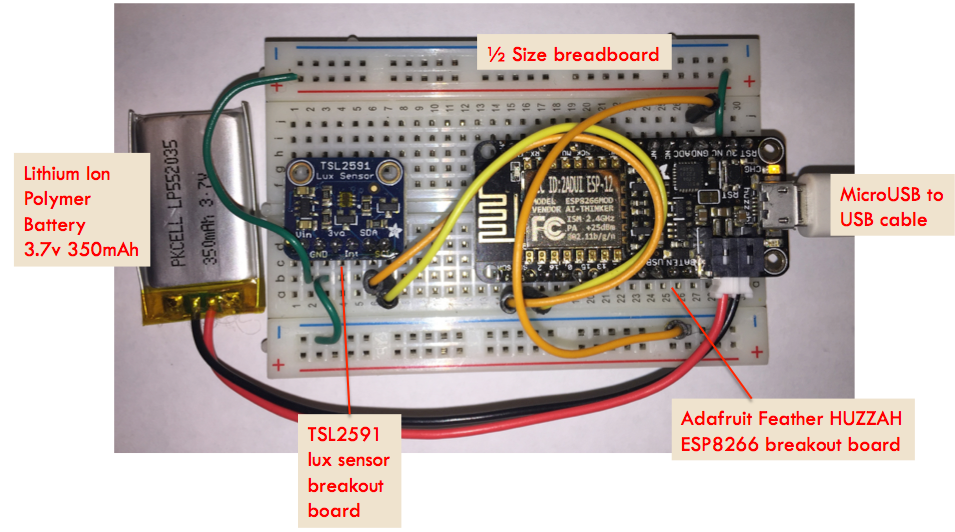
One of the ESP8266 boards
Data Analysis
The light sensor data is next analyzed. I copied the data from the Raspberry Pi to my laptop for the analysis. I used Jupyter to explore and process the light data. The analysis subdirectory contains my Jupyter notebooks (.ipynb files) analyzing the data I captured. The csv files are parsed, post-processed, and read into Pandas data structures.
From there, the light readings are grouped into four levels via K-Means clustering. The four levels are then mapped to on-off values, depending on the particulars of each room (e.g. how much ambiant light is present). I divide each day into four "zones", based on the absolute time of day and sunrise/sunset times. The samples are grouped into subsequences separating them by zone and when there is a gap in the data readings.
These subsequences are then used to train Hidden Markov Models using hmmlearn. Hmmlearn can infer a state machine which can emit a similar pattern of on/off samples. A total of four models are created per room, with one for each zone.
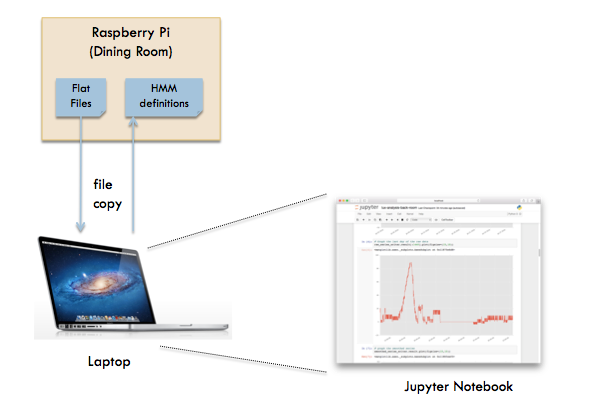
Data analysis workflow
Visualization
The graph below shows the light data collected from one room over 24 hours (starting in the evening and ending the following evening). Many more visualizations may be found in the Jupyter notebooks.
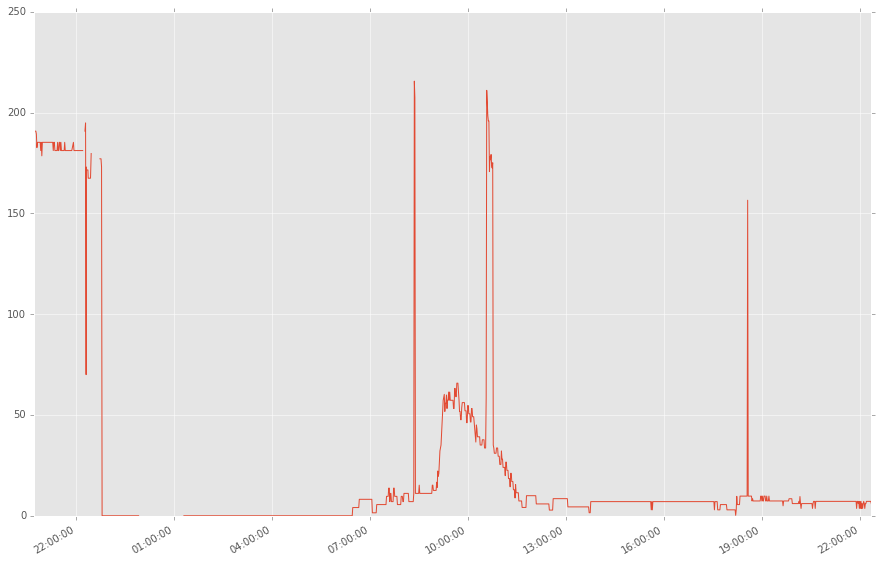
Raw lux data collected from front room
Player
The player subdirectory contains a light controller application which runs off the Hidden Markov Models created in the analysis phase. It controls Philips Hue smart lights, which are accessible via an REST api. We use the phue library to abstract the details of the control protocol.
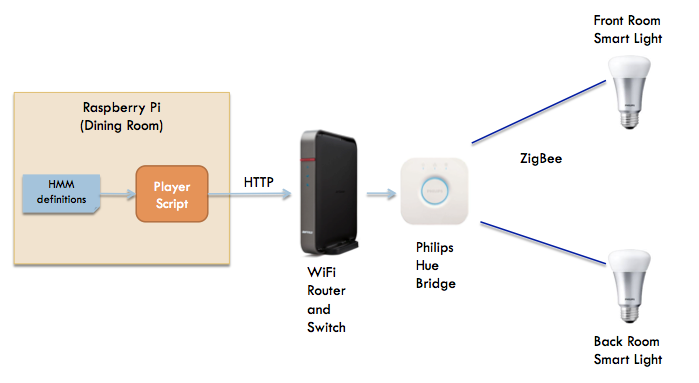
Light pattern player
Player Pseudo-code
The lighting player script itself is quite simple and uses the following logic:
Initial testing of lights
while True:
    compute predicted values for rest of day
    organize predictions into a time-sorted list of on/off events
    for each event:
        sleep until event time
        send control message for event
        wait until next day